
![]()
|
|
| Powerful software that's easy to use! the images on this page are fairly large and may take a moment to load please be patient!
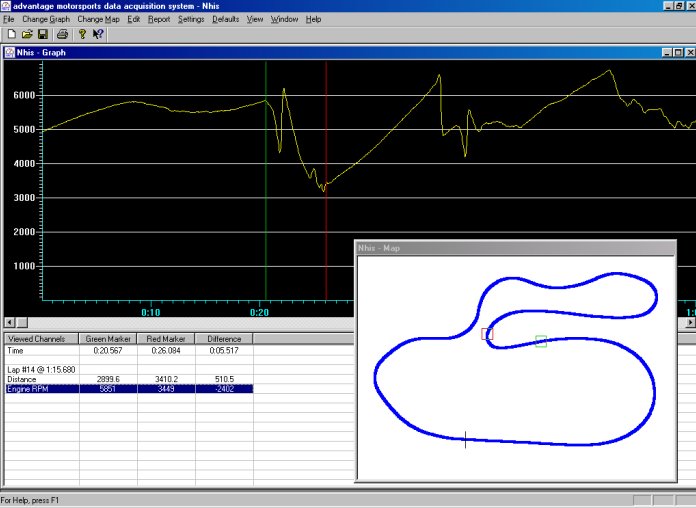
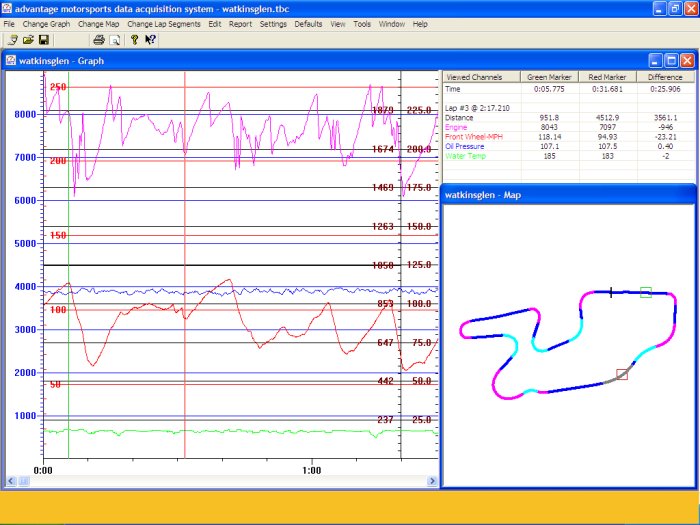
our software will MAP ANY track and allow you to view it on your personal computer! By putting markers into
the data, you can view exactly what was
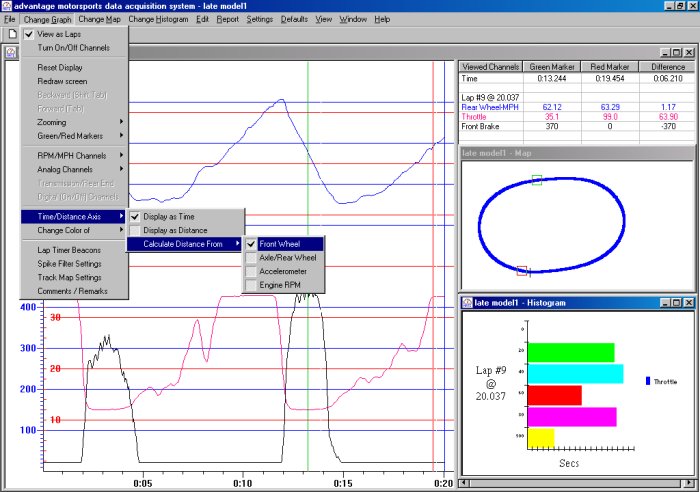
"X" Axis can be displayed as TIME OR DISTANCE. This
is important to
different ways! In the above image the Engine RPM graph is placed on the top part of the screen (pink), Oil Pressure (blue) is in the middle, Front Wheel MPH (red) is below that with Water Temperature (green) in the lower part of the screen!
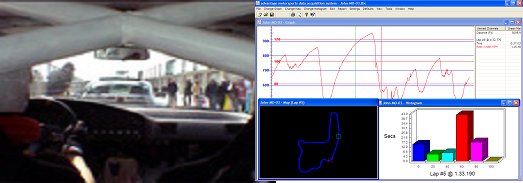
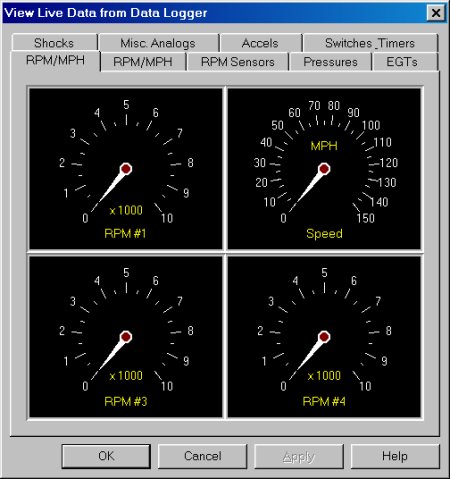
Below are some examples or our "real time" LIVE Virtual DASH data displays! (Live data available on Leading and Ultimate 30 Data Systems)
|
View Live Data from Any Recorded Channels! Above RPM and MPH displays: Watch Engine RPM, Driveshaft RPM, INPUT shaft RPM, Clutch, or Wheel Speed as it happens!
|
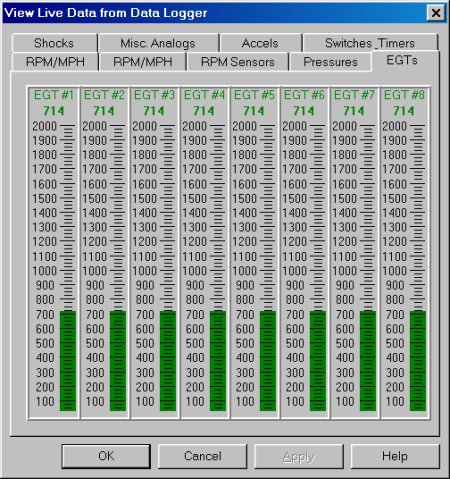
EGT Channels: Real Time 8 EGT displays to allow easy testing and confirmation of all EGT channels.Great for tuning and monitoring of ALL cylinders at one time. Data is given as an actual number at the top of the screen as a bar graph for quick comparisons.
|
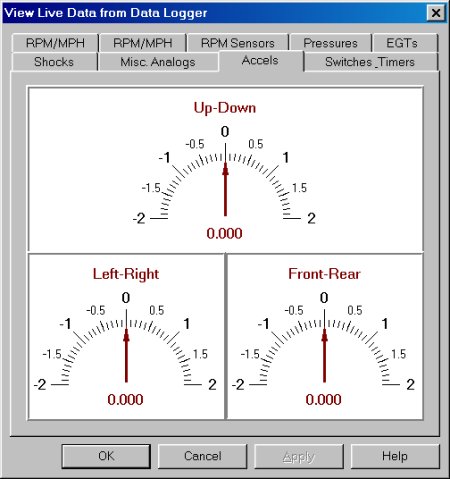
Real Time "G" Sensor screen shown above. Includes Calibration Wizards for all accelerometers (this is critical because race cars aren't perfectly level!)
|
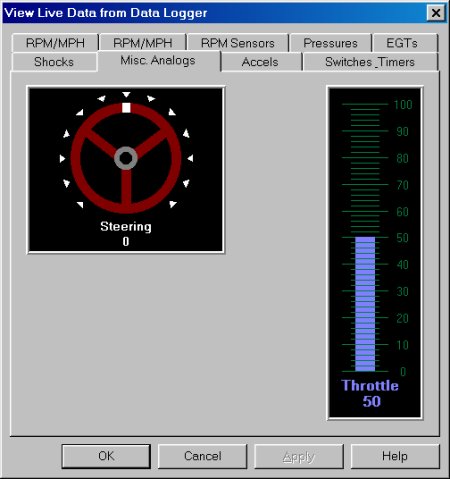
Real Time Steering Wheel and Throttle Display Graphics and Calibration Wizards for fast and easy calibration and verification of these sensors. 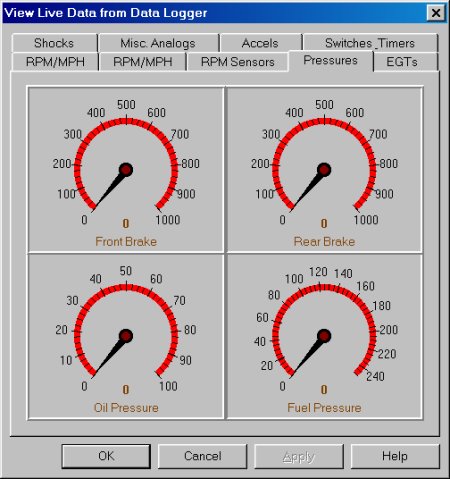
P.S.I. Gauges: P.S.I. sensors are available in many different pressure ranges. The image above shows Front and Rear Brake P.S.I. as well as Oil and Fuel P.S.I. readings.
|
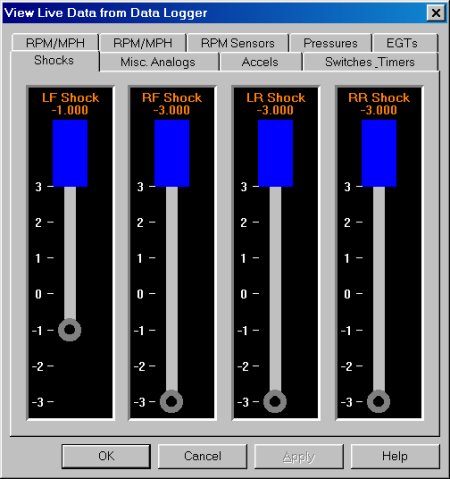
Real Time Shock Sensor Graphics and Shock Sensor Calibration Wizards for super fast and super EASY Shock Sensor Calibration! Additional Software Highlights and Details Easy to Use Our software only requires 1 Click to Download the data On screen notes (not annoying pop ups) for common reminders/hints common sense menus for easy "click through" navigation "Picture" based Quick Start Guides get you started right away Lap, Run and Race Comparison Overlay unlimited number of laps Overlay unlimited number of runs or races (many systems limit you here) Overlay laps or runs from different races or even racetracks
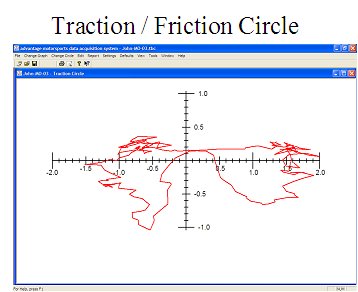
Additional Standard Features (see below for additional details of these features) Histograms Traction (Friction Circle) Track Mapping X Axis can be displayed as Time or Distance Automatic Calculations including Slip 1 "click" automatic calculations with automatic % (percentage) graph displayed Engine vs. Clutch Slip Input Shaft vs. Engine Engine vs. Driveshaft Automatic percentage graphs for slip MPH calculations using tire diameter or circumference Transmission and Rear End Gear Ratio for Shift Points and Slip Calculations Complete Timing Report Information Circle track and Road Racers: Lap Time Reports Laps can be entered by Elapsed Time (Cumulative) or Relative (Real Time) Lap Times can be entered with the keyboard or automatically with our Lap Timing Options Laps can be deleted or added without worrying about affecting the position of the other lap markers Software allows multiple Lap Timer Beacons (1-4) Complete Comments Reports Section to freely enter any important information about the session/run Drag Racers: Launch Time:60 foot; 330, 660 (1/8 mile), 1000 ft., 1320 (1/4 mile) times On screen markers to easily ID each section of the Run Timers can be used to monitor Shift solenoids, transbrake, nitrous switches etc. Unlimited Channel Control User can view unlimited number of recorded channels on the screen at the same time User can turn on and off any combinations of channels with easy on/off buttons For Example: Display RPM data for laps 1&2 and shock data for laps 3&4;ANY combination is allowed Colors can be changed for any channel or graph with a simple click of the mouse User preference to set each individual lap as an 1 color or separate colors for each graph Special color settings can be saved, and applied automatically to future graphs Powerful Windows Software We use the latest Microsoft Installation programs within our Software to insure compatibility with all supported versions of Windows and protection of your computer 32 Bit software operates fast and more efficient than 16 Bit software Compatibility with Windows 95, 98, 98SE, ME, and XP Our software is designed to work with older computers in mind, you DO NOT need the latest and greatest computer to run our software Zooming 1 Click Zoom for zooming left to right (X axis) 1 Click Zoom for zooming up and down (Y axis) Click and Hold mouse to hyper zoom into any portion of the graph "Hot Keys" for all Zoom functions allows quick zooming functions, as well as scrolling Backwards and Forward buttons allow to easily re-do zooming functions Advanced Marker Information (Cursor) Features 1 Click placement of Markers automatically show numeric (real numbers) in a Marker Display Window The marker display window can be placed to the right or below the data (along the bottom of the screen) Markers can be moved with mouse or by simply holding down the left or right arrows on keyboard Holding down the arrow keys will allow the marker to scroll through the data automatically updating the data values as it goes The marker display window can be placed to the right or below the data (along the bottom of the screen) "Real Time" Live Data (Ultimate 30 Systems Only) (Real Time images can be seen at the bottom of page) View Live Data from Any Recorded Channels Analog Gauge Style RPM, MPH, "G" sensor and P.S.I. (pressure) displays Live LED "blinking " display to quickly ID signal from magnets and RPM/MPH sensors Real Time 8 EGT displays to allow easy testing and confirmation of all EGT channels Calibration Wizards for all accelerometers (this is critical because race cars aren't perfectly level!) Real Time Steering Wheel Display Graphics and Calibration Wizards for Steering Sensor Calibration Real Time Throttle for fast and easy calibration and verification of TPS sensors Real Time Shock Sensor Graphics and Shock Sensor Calibration Wizards for Shock Sensor Calibration Real Time On/OFF switch displays Lap Timer testing screens
Advanced Print Functions Print Data Graph with or without cursors Print Histogram with or without Report Print Track Map with or with out Markers/Cursors Print Data Report for Graph for all recorded channels or just viewed channels Any print function can be printed in landscape or portrait Print preview feature allows changes prior to printing including viewing multiple page prints Color Selection User can select colors for the Background, Scales, Data Graphs, X & Y scales, etc. User can select colors for Track Maps, including Background, Track Color and Start/Finish Line Color Units of Measure Data can be displayed in Imperial (MPH, Fahrenheit, PSI, etc.) Data can be displayed in METRIC (KPH, Celsius, KPA, etc. Advanced PC User Functions Choice of 8 COM Ports (particularly helpful with USB adapters) Advanced User Options Complete Default Settings to automatically customize the data as you download to your preferences User Defined Individual Channel Smoothing (none, light, medium, heavy) User Defined Individual Channel Spike Filters (different than smoothing) User Defined Individual Analog Scaling Feature (Full Scale, Maximum Extents, Top or Bottom Half view) User Defined Individual Analog Sensor offset adjustment: allows neutral position of Analog Scales can be turned ON and OFF without turning graph off (allows wider viewing area) Similar Analog Scales can combined (also allows wider viewing area) Customer Defined options for easy use and naming of "uncommon" analog sensors INVERT analog to allow channel to be viewed in opposite direction (important for advanced users) for example: the "G" force graph goes up on acceleration; but you would like the direction of the graph to go the other way; 1 "click" and its done 1 Click Export Option allows data to be exported into other programs like Microsoft Excel Menu Help "tips" can be turned off for the Advanced User "Set Zero Time" allows Different Drag Racing runs to be perfectly overlaid Adjust Lap Markers allows Different Circle Track and Road Racing runs to be perfectly overlaid Track Mapping Features note: Track Mapping requires MPH (speed) and Lateral (cornering) "G" sensor Identification markers show exact position on the racetrack Identification markers display and update simultaneously with the data graph Actual Data Values will display with just a click into any point on the track map Closed Laps (continuous laps crossing over start finish) can be mapped Open Laps (autocross, solo) can be mapped Software can draw maps using front or rear wheel speed User can select colors for Track Maps, including Background, Track Color and Start/Finish Line Color User can select colors for Track Maps, including Background, Track Color and Start/Finish Line Color Traction (Friction) Circle Features note: Traction Circles require Lateral (cornering) and Longitudinal (braking/acceleration) "G" sensors Traction Circle Analysis for a complete session, an individual lap or for a particlular segment or section of the racetrack Display "X" axis grid, "Y" axis grid, combination grid, or no grid for Traction Circle Display Lateral "G", Longitudinal "G", and Max "G" values for any portion of the Traction Circle Change Background Color as well as X and Y Axes colors Advanced User Options User Defined Individual Channel Smoothing (none, light, medium, heavy) User Defined Individual Channel Spike Filters (different than smoothing) User Defined Individual Analog Scaling Feature (Full Scale, Maximum Extents, Top or Bottom Half view) Customer Defined options for easy use and naming of "uncommon" analog sensors Our standard Windows Data Analysis software will operate in Windows 98, 98SE, Millenium Edition (Windows ME), WIN 2000, and Windows XP Home and XP Pro AND NOW WINDOWS VISTA!!! While we also carry older software for Windows 3.11 & Windows 95, we strongly encourage not purchasing a used computer with these operating systems (new computers come with XP or Vista).
Our software will also allow you to export Data to programs like Microsoft Excel | ||||||||||||||||||||||||||||||||||||||||||||||||||||||||||||||||
|
Send mail to info@advantagemotorsports.com with questions, price quotes, or order info.Copyright Advantage Motorsports 1996 - 2007
|